

What Is a Put Wall in Options and How Call Walls Dictate Stock Support and Resistance Levels
Executive SynthesisLearn what is a put wall in options how market maker dealer gamma hedging creates mechanical stock support floors and call wall ceilings and how Saku maps options flow automatically.
What Is a Put Wall in Options Trading and Why Does It Act as Mechanical Support
If you have ever watched a heavily traded stock sell off sharply all morning only to bounce to the exact penny off a seemingly invisible price level and rally into the close you have witnessed the mechanical power of an options Put Wall. While retail traders draw subjective diagonal trendlines on candlestick charts institutional quantitative desks map the exact strike prices where options market makers hold their largest net gamma exposure.
So what is a put wall in options trading. A Put Wall is the specific below market option strike price across an asset options chain that holds the highest concentration of put open interest volume and net dealer gamma exposure. Because institutional portfolio managers and pension funds routinely buy protective puts at major round strikes options market makers sit on the other side of that trade as net short puts.
Having spent eighteen years inside enterprise banking at TD Bank Group architecting financial market technology and holding both FINRA and IIROC regulatory licenses I watched institutional derivatives desks use Put Walls and Call Walls as their primary intraday roadmap. We built Saku Financial Inc. to translate these complex institutional options and dark pool barriers into plain English inside a 100 percent free ad free terminal across Web iOS and Android.
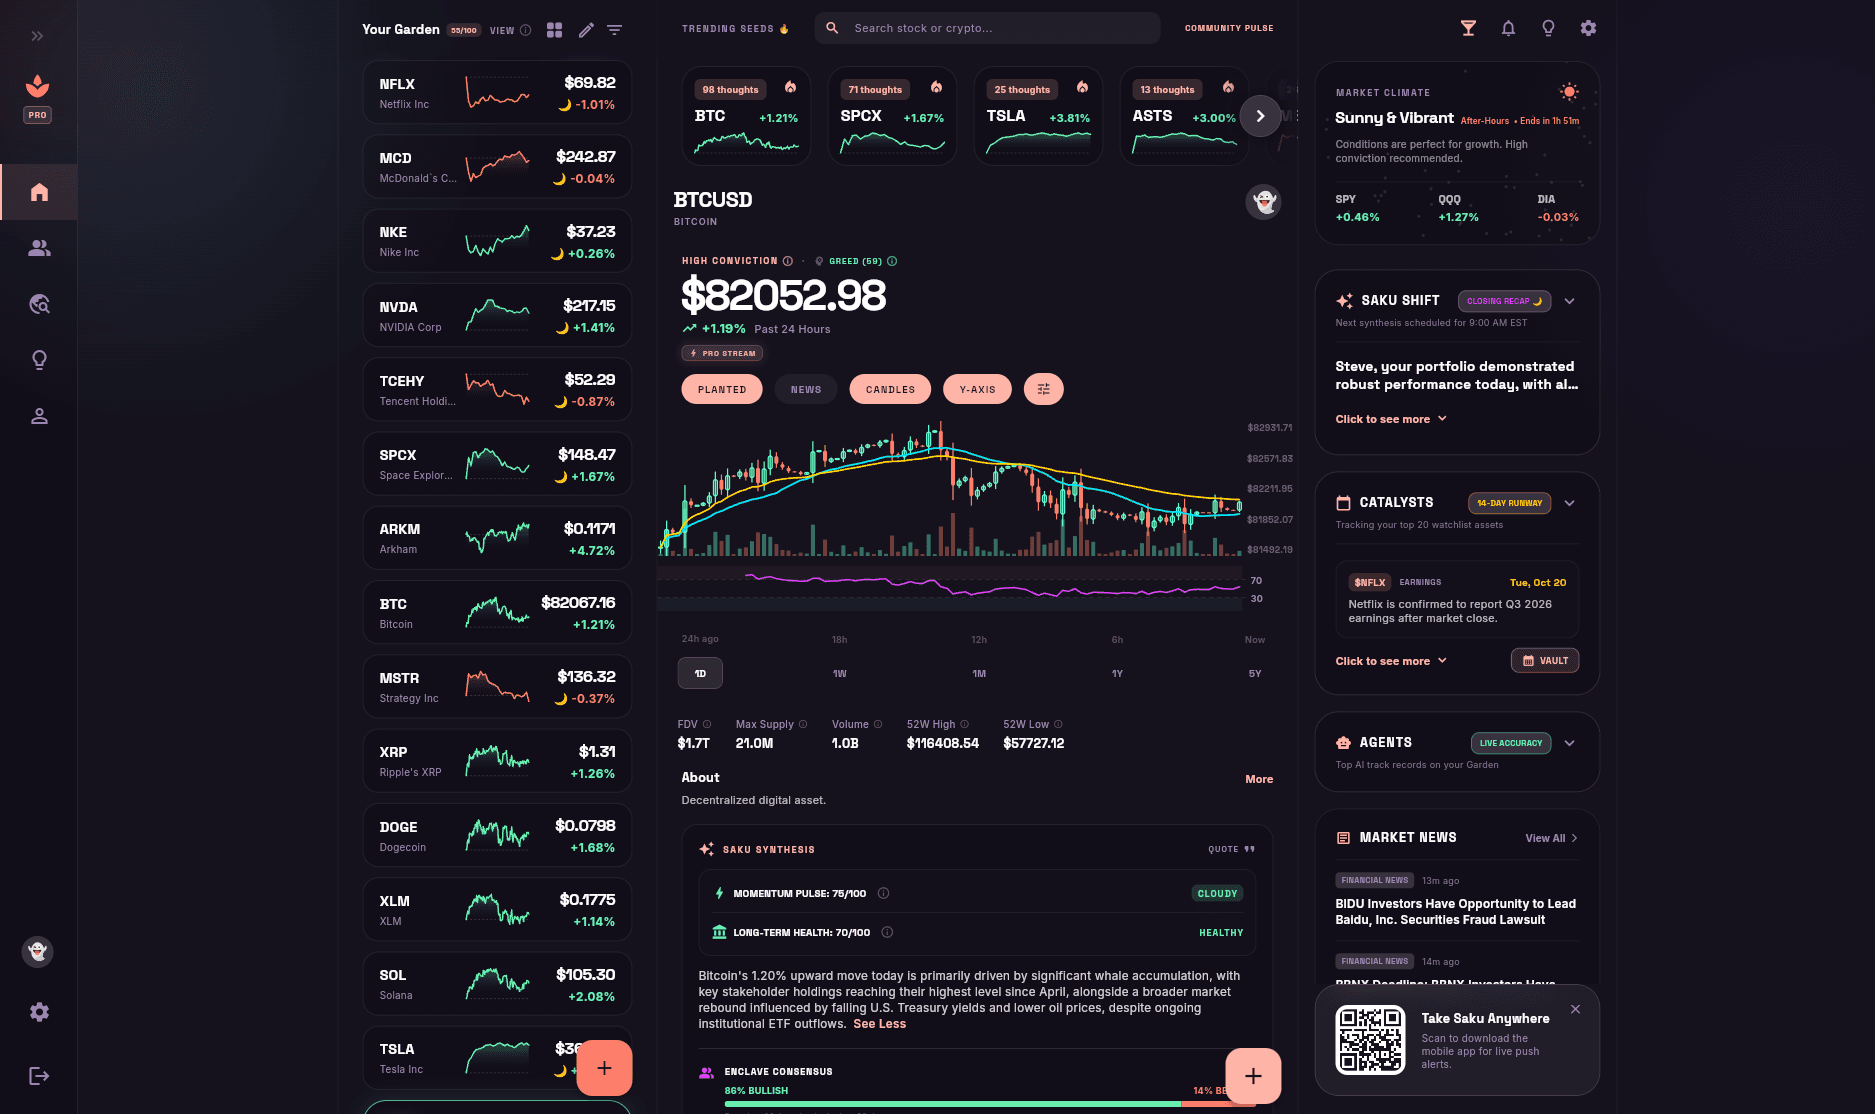
See Live Dark Pool Flow & AI SEC Synthesis in Action
Don't just read about institutional order flow—track it live on your favorite stock or crypto ticker right now.
The Dealer Delta and Gamma Hedging Math Behind a Put Wall Bounce
To understand why a Put Wall stops a stock decline you have to look at how an institutional options market maker manages risk. Market makers do not want to gamble on whether a stock goes up or down. Instead they capture the bid ask spread while keeping their portfolio delta neutral through continuous mechanical hedging in the underlying stock.
As a stock drops toward a major Put Wall strike where customers have purchased thousands of protective put contracts the value and delta of those puts increase. However as spot price approaches the Put Wall and implied volatility begins to stabilize or decay known as vanna and charm flows market makers who hedged those puts by shorting the underlying stock must buy back shares to rebalance their delta.
Even more importantly when institutional whales take profit on their in the money puts right at the Put Wall strike dealers immediately unwind their short stock hedges by executing aggressive buy programs on the lit tape. As we detailed in our foundational breakdowns on what is a put wall and negative gamma mechanics and what is a call wall and dealer gamma pinning these mechanical hedging flows create powerful price floors and ceilings.
How the Call Wall and Zero Gamma Flip Level Frame the Trading Range
Just as the Put Wall defines the mechanical institutional floor at the bottom of the options chain the Call Wall defines the primary overhead resistance ceiling. The Call Wall is the strike price above current spot with the largest concentration of call gamma where dealers are net long gamma from selling covered calls to retail and institutional speculators.
When a stock trades above the zero gamma flip level and approaches the overhead Call Wall dealers are in positive gamma territory. Every time the stock ticks higher dealers must sell shares to stay delta neutral which dampens volatility and pins the stock price just below the Call Wall strike into Friday expiration.
What happens if a stock breaks decisively below its Put Wall during a macroeconomic selloff. As we explained in our tactical guide on how to trade call walls put walls and the zero gamma flip level breaking below a Put Wall pushes dealers into deep negative gamma forcing them to sell shares into the decline and accelerating a liquidation cascade until the next lower strike wall is reached.
Track live dark pool flow & hatch your Personal AI Quant at Desk #4.
Verifying Put Wall Support with Off Exchange Dark Pool Prints and 25d Skew
How do you know whether a Put Wall will hold as a rock solid bounce floor or snap under institutional selling pressure. You never trade a Put Wall in isolation. Instead institutional traders cross reference the Put Wall strike against two confirmation signals: off exchange dark pool block accumulation and the 25 delta risk reversal skew.
As we demonstrated in our guides on 25d risk reversal ETH and options skew and solutions combining dark pools with AI document analysis if a stock tests its Put Wall while dark pool block prints show heavy institutional buying at the bid and SEC filings confirm zero fundamental deterioration the probability of a violent upside mean reversion surges.
Inside Saku you can inspect these exact support and resistance zones across our live NVDA AI price target and support levels dossier our SOFI stock support levels and AI analysis hub our AAOI support levels and whale flow dossier and our SpaceX SPCX AI price target and catalyst hub.
Why Put Walls Shift Ahead of Major Earnings and FOMC Catalysts
One of the biggest mistakes self directed traders make is assuming that a Put Wall or Call Wall stays fixed at the same strike price all month. Whenever a binary corporate earnings release FOMC interest rate decision or Consumer Price Index inflation report approaches options implied volatility expands and institutional desks roll their hedges to wider strikes.
As we covered in our guide to tracking recent news catalysts and upcoming earnings dates once an earnings announcement passes implied volatility crushes overnight. That sudden volatility crush known as vanna flow forces dealers to rapidly unwind out of the money put hedges pulling the stock magnet like back toward the central gamma strike.
By checking our live 14 Day Enclave Catalyst Calendar before placing a trade you can see exactly when upcoming earnings or macro releases are scheduled to reprice the options surface across your watchlist.
Automating 24/7 Support and Options Wall Monitoring at Workstation 4
Manually calculating net gamma exposure across thousands of option strikes while monitoring off exchange dark pool tape and SEC filings is impossible for an individual investor. Inside the Saku Living Agent Sanctuary our autonomous AI quant agents automate that entire institutional workflow for you.
Every trading day our three House Quant Agents scan Crypto Momentum (10:00 AM EST) Macro Catalysts (12:00 PM EST) and Fundamental Value (2:00 PM EST) and lock verified 1 month predictions on our public Oracle Ledger. Even better as we detailed in our guide to the best AI agents to monitor the stock market 24/7 you can claim Workstation Number Four for free to hatch your own Personal AI Quant Companion.
Your Personal Companion guards your favorite stock ETF or crypto ticker around the clock and delivers automated shift briefings at 9:00 AM EST 12:00 PM EST and 4:30 PM EST complete with updated support and resistance zones. Launch the 100 percent free ad free Saku terminal on Web iOS or Android today to trade with institutional options clarity.
What is a put wall in options trading?
A put wall in options trading is the strike price below current spot with the largest concentration of put open interest and net dealer gamma exposure. It acts as a mechanical support floor because options market makers unwinding short stock hedges or buying against put profit taking create institutional buying pressure at that level.
What is the difference between a put wall and a call wall?
A put wall sits below the current stock price and acts as a mechanical support floor where dealer hedging arrests declines whereas a call wall sits above the current stock price and acts as a mechanical resistance ceiling where positive dealer gamma pins rallies.
How can retail traders see stock support levels and put walls for free?
Saku (SakuStocks) translates complex options Call Walls Put Walls support and resistance channels and off exchange dark pool flows into plain English inside a 100 percent free ad free terminal across Web iOS and Android.
Related Institutional Research
View All Research →SPCX SpaceX Ecosystem and AAOI Stock Analysis: AI Price Targets Support Levels and Dark Pool Flow
Explore how self directed traders track the SpaceX ecosystem via SPCX and AI optical hardware leader AAOI using Saku live support levels dark pool prints and RAG AI SEC filing synthesis.
StockTwits Alternatives: How to Find Verified Trading Alpha and Spot Fake Gurus
The financial social media landscape is flooded with 'fake gurus' who delete losing trades to artificially inflate their win rates. The best alternative to platforms like StockTwits are networks that use immutable prediction ledgers and mathematically verified accuracy ratings to hold influencers accountable.
Why 15 Second Delayed Market Data is Quietly Costing Retail Traders
If your stock tracker refreshes every 15 seconds you are trading entirely in the past. Discover how institutional algorithms exploit delayed data and how Saku uses split second streaming to level the playing field.
Recent News Catalysts and Upcoming Earnings Dates Calendar: How AI Tracks TSLA NVDA PLTR and SPCX Events
Track recent news catalysts and upcoming earnings dates for TSLA NVDA PLTR AAOI and SPCX using the Saku 14 day Enclave Catalyst Calendar dark pool flow and RAG AI filing synthesis.

Steven White, MBA
Formerly FINRA & IIROC LicensedFounder & Architect, Saku Financial Inc. • 18-Year TD Bank Group Veteran
Steven spent 18 years at TD Bank Group architecting enterprise product operations, strategy, and financial market technology, and previously held both FINRA and IIROC regulatory licenses. He built Saku to level the playing field—giving self-directed retail investors the same institutional-grade RAG AI synthesis, dark pool order flow, autonomous quant agents, and verified prediction ledgers used by the smart money.
Put Institutional Intelligence to Work.
Track live dark pool prints, read instant RAG AI SEC filing syntheses, and hatch your own personal AI quant companion inside the Saku Sanctuary.